

$VIX
VIX is the market’s fear number. It is not a stock. It is a reading of how expensive protection is on the S&P for the next month. When traders get nervous they buy that protection and the number goes up.When they calm down they stop paying for it and the number comes down.
That is why stocks and VIX usually run opposite. SPY selling off with VIX ripping means people are paying up. SPY dipping with VIX falling is the quieter tape.
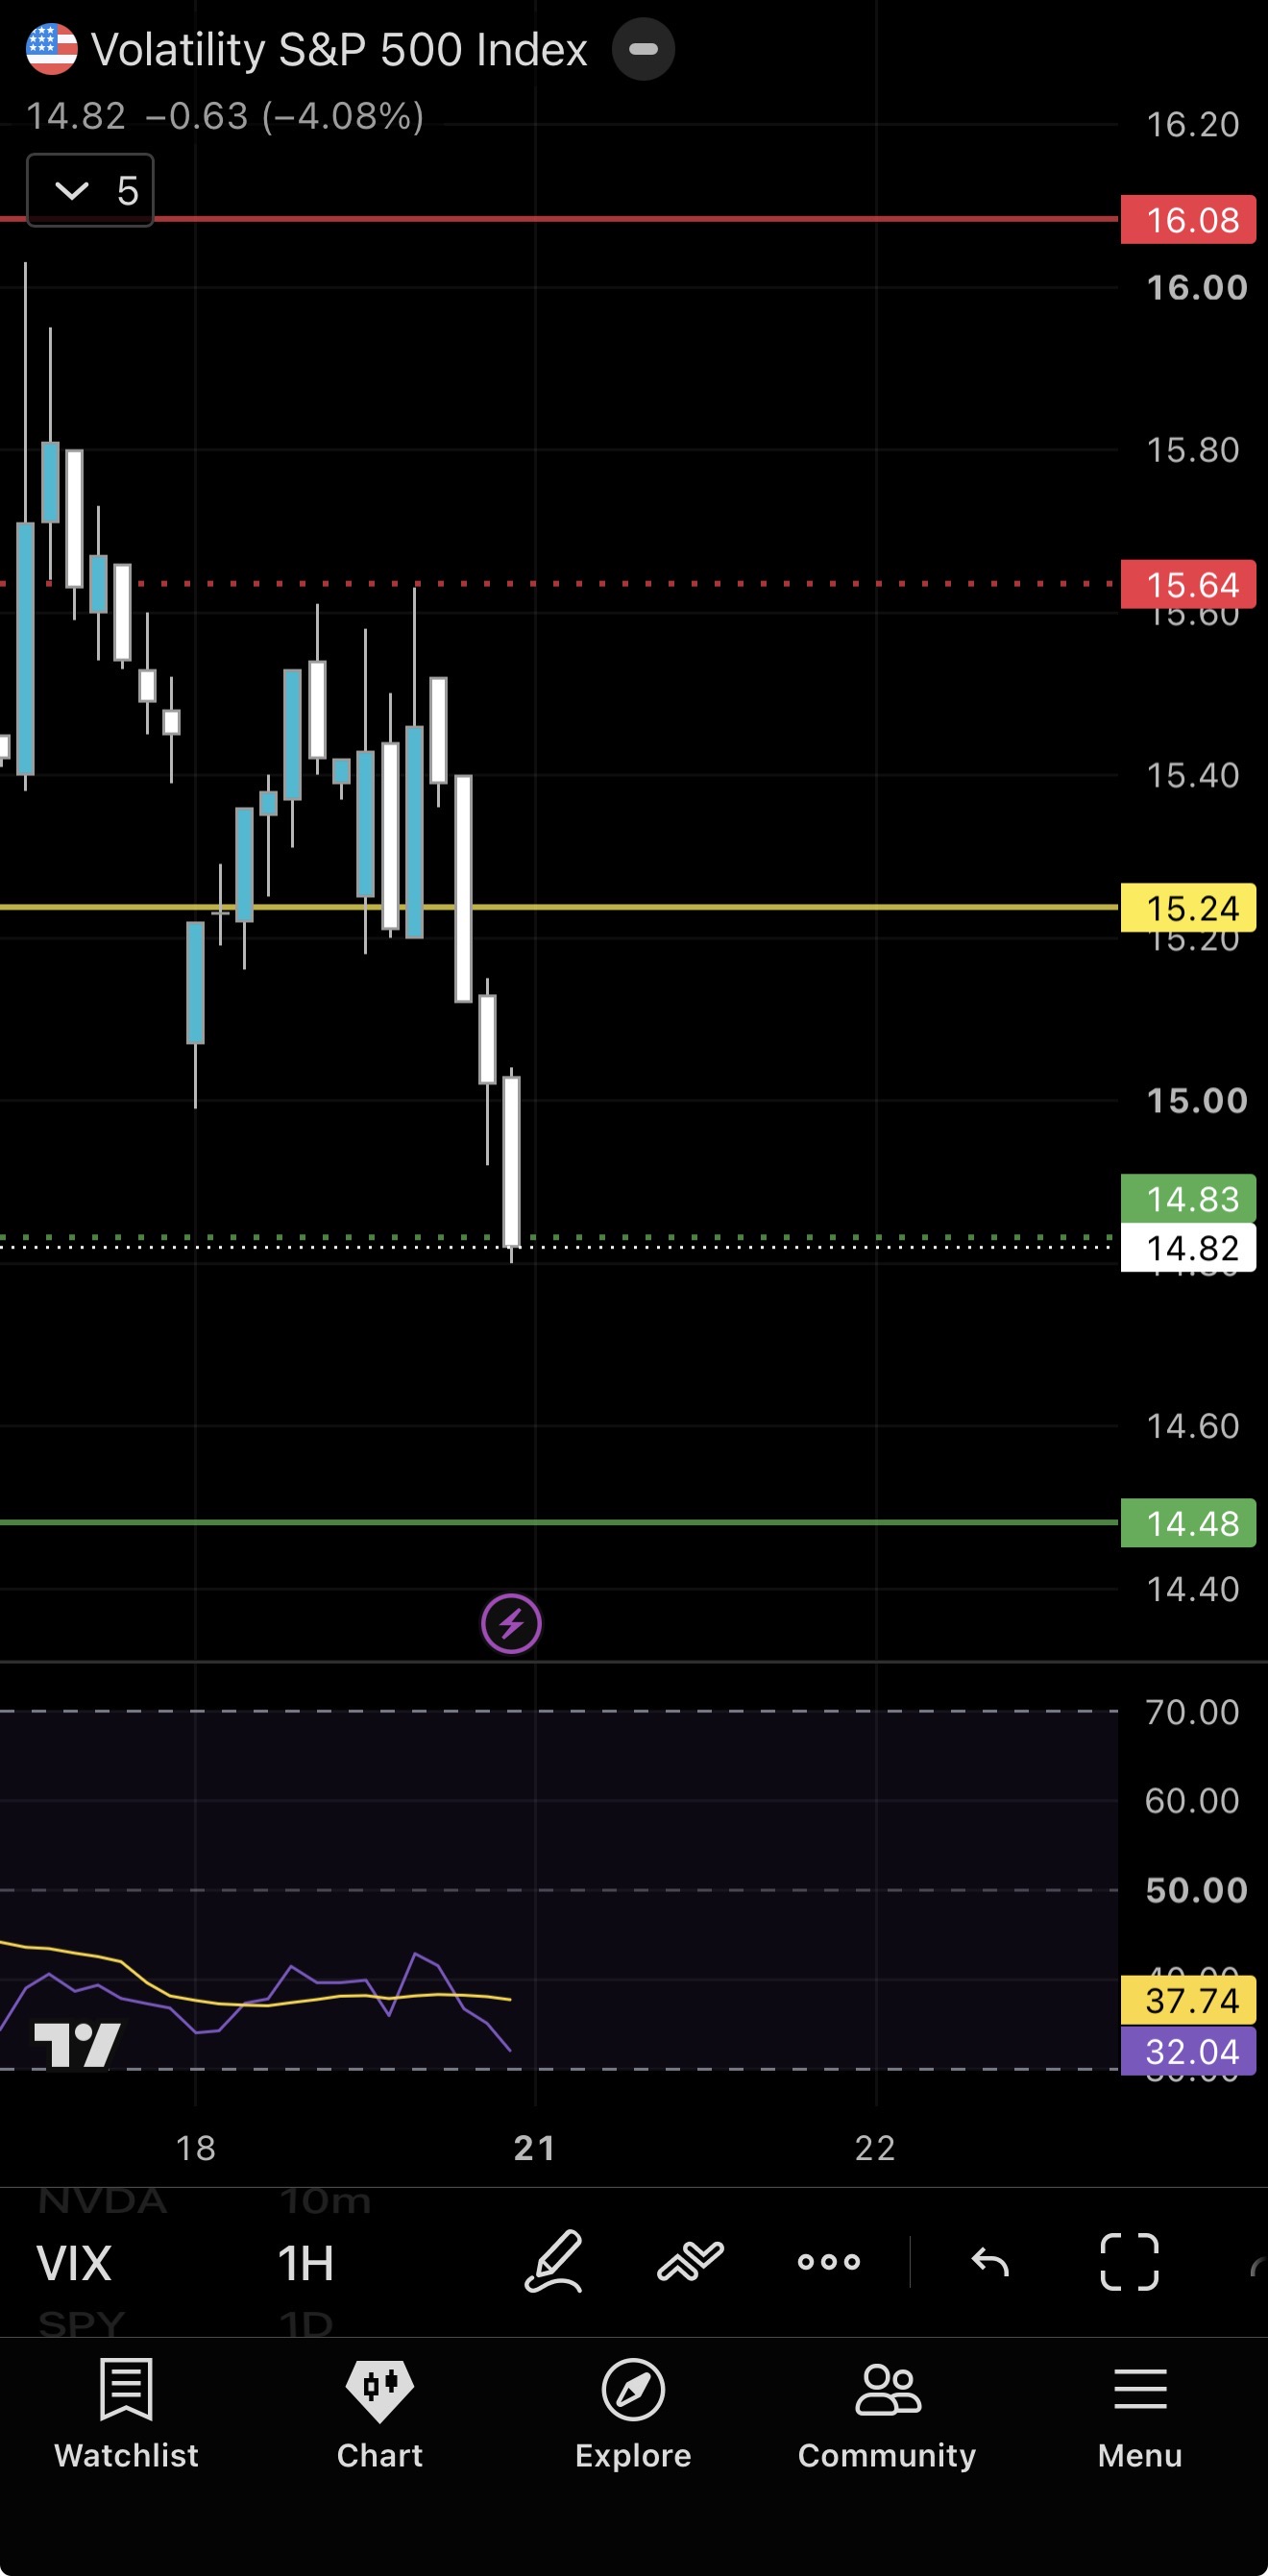
Friday closed around 15. That is low. 20 is when the room sits up. 30 is a mess. Below we will breakdown the ranges
Low vs high
Under 12 is extreme quiet
Insurance is almost free. Market is priced for perfection. Not common.
2017 sat here for months and even tagged about 9. Then Feb 2018 (Volmageddon) went from the low teens to about 50 in two days.
Aug 2015 tagged the 11s before the China scare ran VIX into the 40s–50s. This does not mean crash tomorrow. It means almost nobody is hedged, so a shock reprices fast.
12–15 low/complacent
Where we are now. Friday 14.82. Cheap insurance. Dips are easier. Calm can last weeks or months.
Since 1990 the market spends roughly a third of all days under 15. So this is quiet.
The tell: after VIX gets this cheap, it usually does not stay cheap forever. Most of those stretches still produce a pop back over 18 inside six months. Not always a crash. A scare.
This is when hedges are on sale. Not when you sell them.
15–20 normal
Default bull market tape. Median lives in here historically speaking. Nothing special. Trade the chart.
20–25 elevated
Room sits up. People are paying for protection again. Rips get harder. First real “something is off” zone.
25–30 high
Stress. Bounces need proof. This is correction/event territory, not background noise.
30–45 fear
Crisis tape. 2011 debt-ceiling/Europe tagged the high 40s.
45+ panic
Rare. 2008 peaked about 81. COVID March 2020 peaked about 83. Feb 2018 tagged about 50. These are the years people tell stories about.
The curve
The number on the chart is one reading. The market also prices fear next month, the month after, three months out. Line those up and you get a curve. Free site is vixcentral.com.
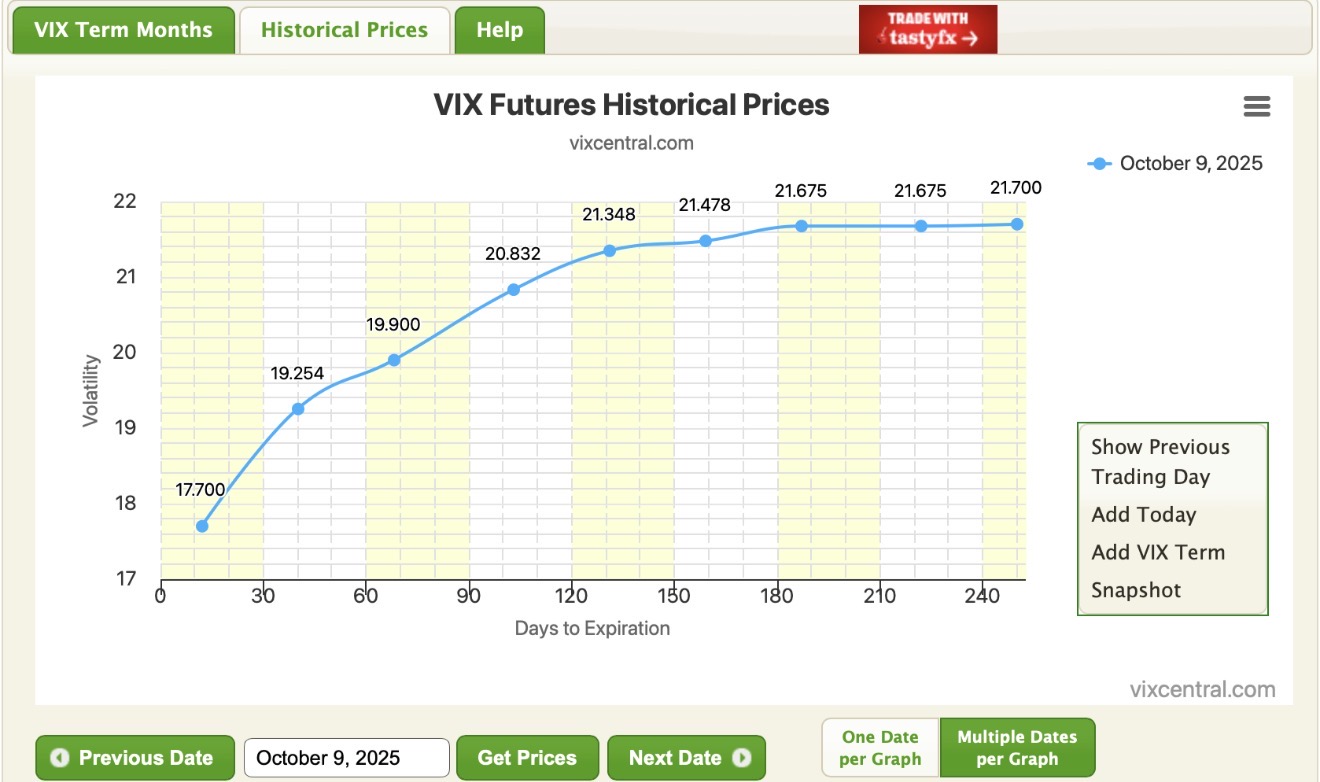
Up and to the right is “normal”. Near months cheaper, later months a little more expensive. Nobody is panicking today. They will still pay extra to keep insurance on later. People call that contango. You do not need the word. Remember the picture.
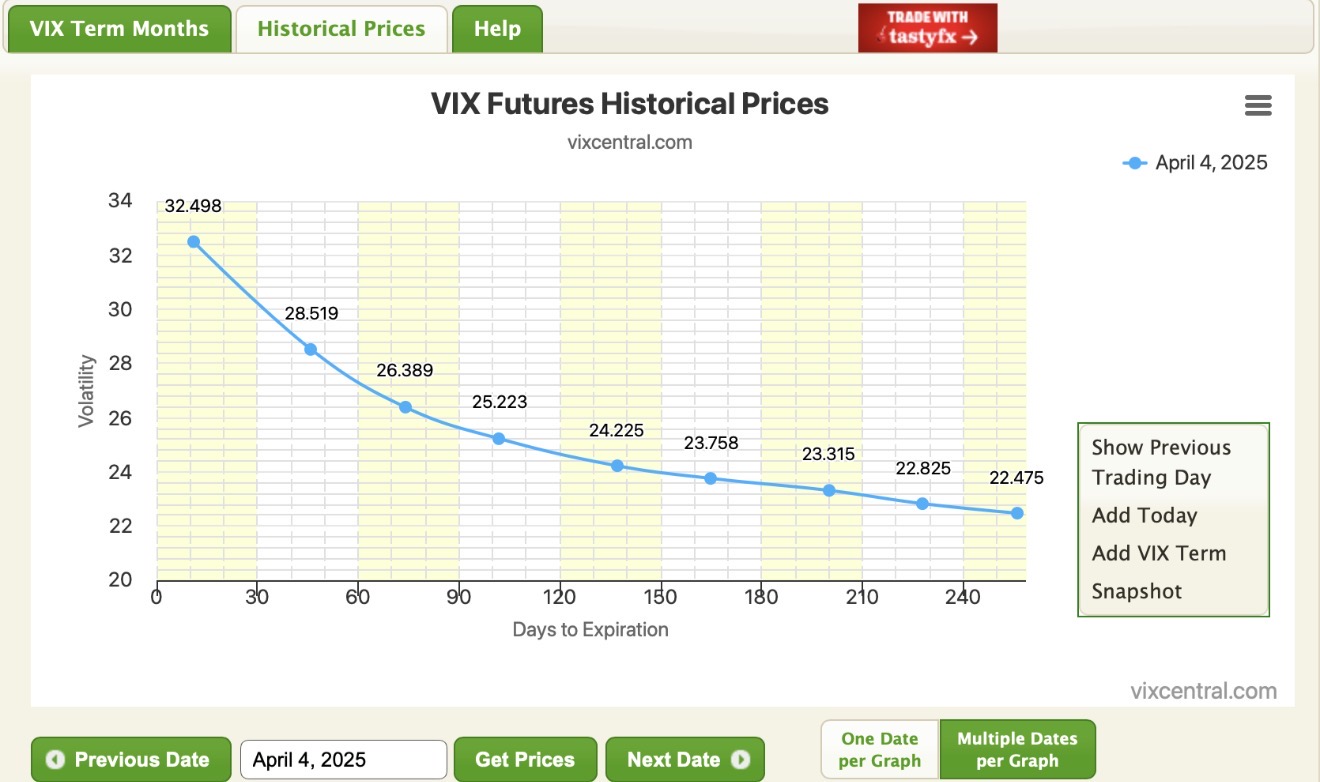
Down and to the right means the problem is now. Front is expensive. Later months are cheaper. People call that backwardation. That tape does not bounce clean.
How to read it in one pass
Is the number low or high.
Is the line on vixcentral going up, flat, or down.
Did only the front month move, or did the whole curve move.
Low and the line pointing up is a calm market.
Low and small caps already leaking is a squeeze, not a clean all-clear.
High and the line pointing down is stress. Respect it.
That is the whole job of VIX on the morning map. It tells you if the tape is relaxed, nervous, or already paying for a problem.