

Most traders draw support and resistance off swing highs and round numbers. Those lines are maps of where price has been. Dark pool prints are maps of where whales/size actually changed hands when nobody was supposed to see it.
If you already watch options heatmaps and flow, you already know the idea. Flow does not predict the future. It shows where positioning is concentrated at and where dealers have to defend, hedge, or unwind.
Dark pool data is the cash equity version of the same map. It is the “unknown liquidity” and the size that never advertised itself on the public book, then left a receipt after the fill. That is why some of us treat dark pool levels as the only S/R on the chart. Not because they are magic. Because they mark inventory.
What you are actually looking at
A dark pool is a regulated Alternative Trading System. It does not show its order book to the public. A pension fund can work a million-share order inside the venue without putting that bid on Level 2.
After the trade fills, it still has to report through FINRA and hit the tape. The print you see on a scanner is not the live order. It is the receipt.
A single off exchange print is not “smart money is buying.” A lot of that tape is facilitation, hedging, and algos slicing a block. The edge is not worshipping every print. The edge is finding where size clustered at a price, then watching how price treats that price later.
Why the unknown liquidity exists
Put a 4 million share buy on a name that trades 8 million a day and two things happen. The market sees the intent aa information leakage. Then the order walks the book and the average fill drifts against the fund market impact resulting in a negative effect.
Dark pools exist to mute both. The order stays hidden, matches inside the venue, and often prints near the midpoint of the public bid-ask. By the time you see it, the shares have already changed hands. The retail implication is simplerHidden size can be a wall. Hidden size can also be fuel.
Why a print becomes S/R
A normal support line is a memory. A dark pool level is a cost basis plus unfinished business.
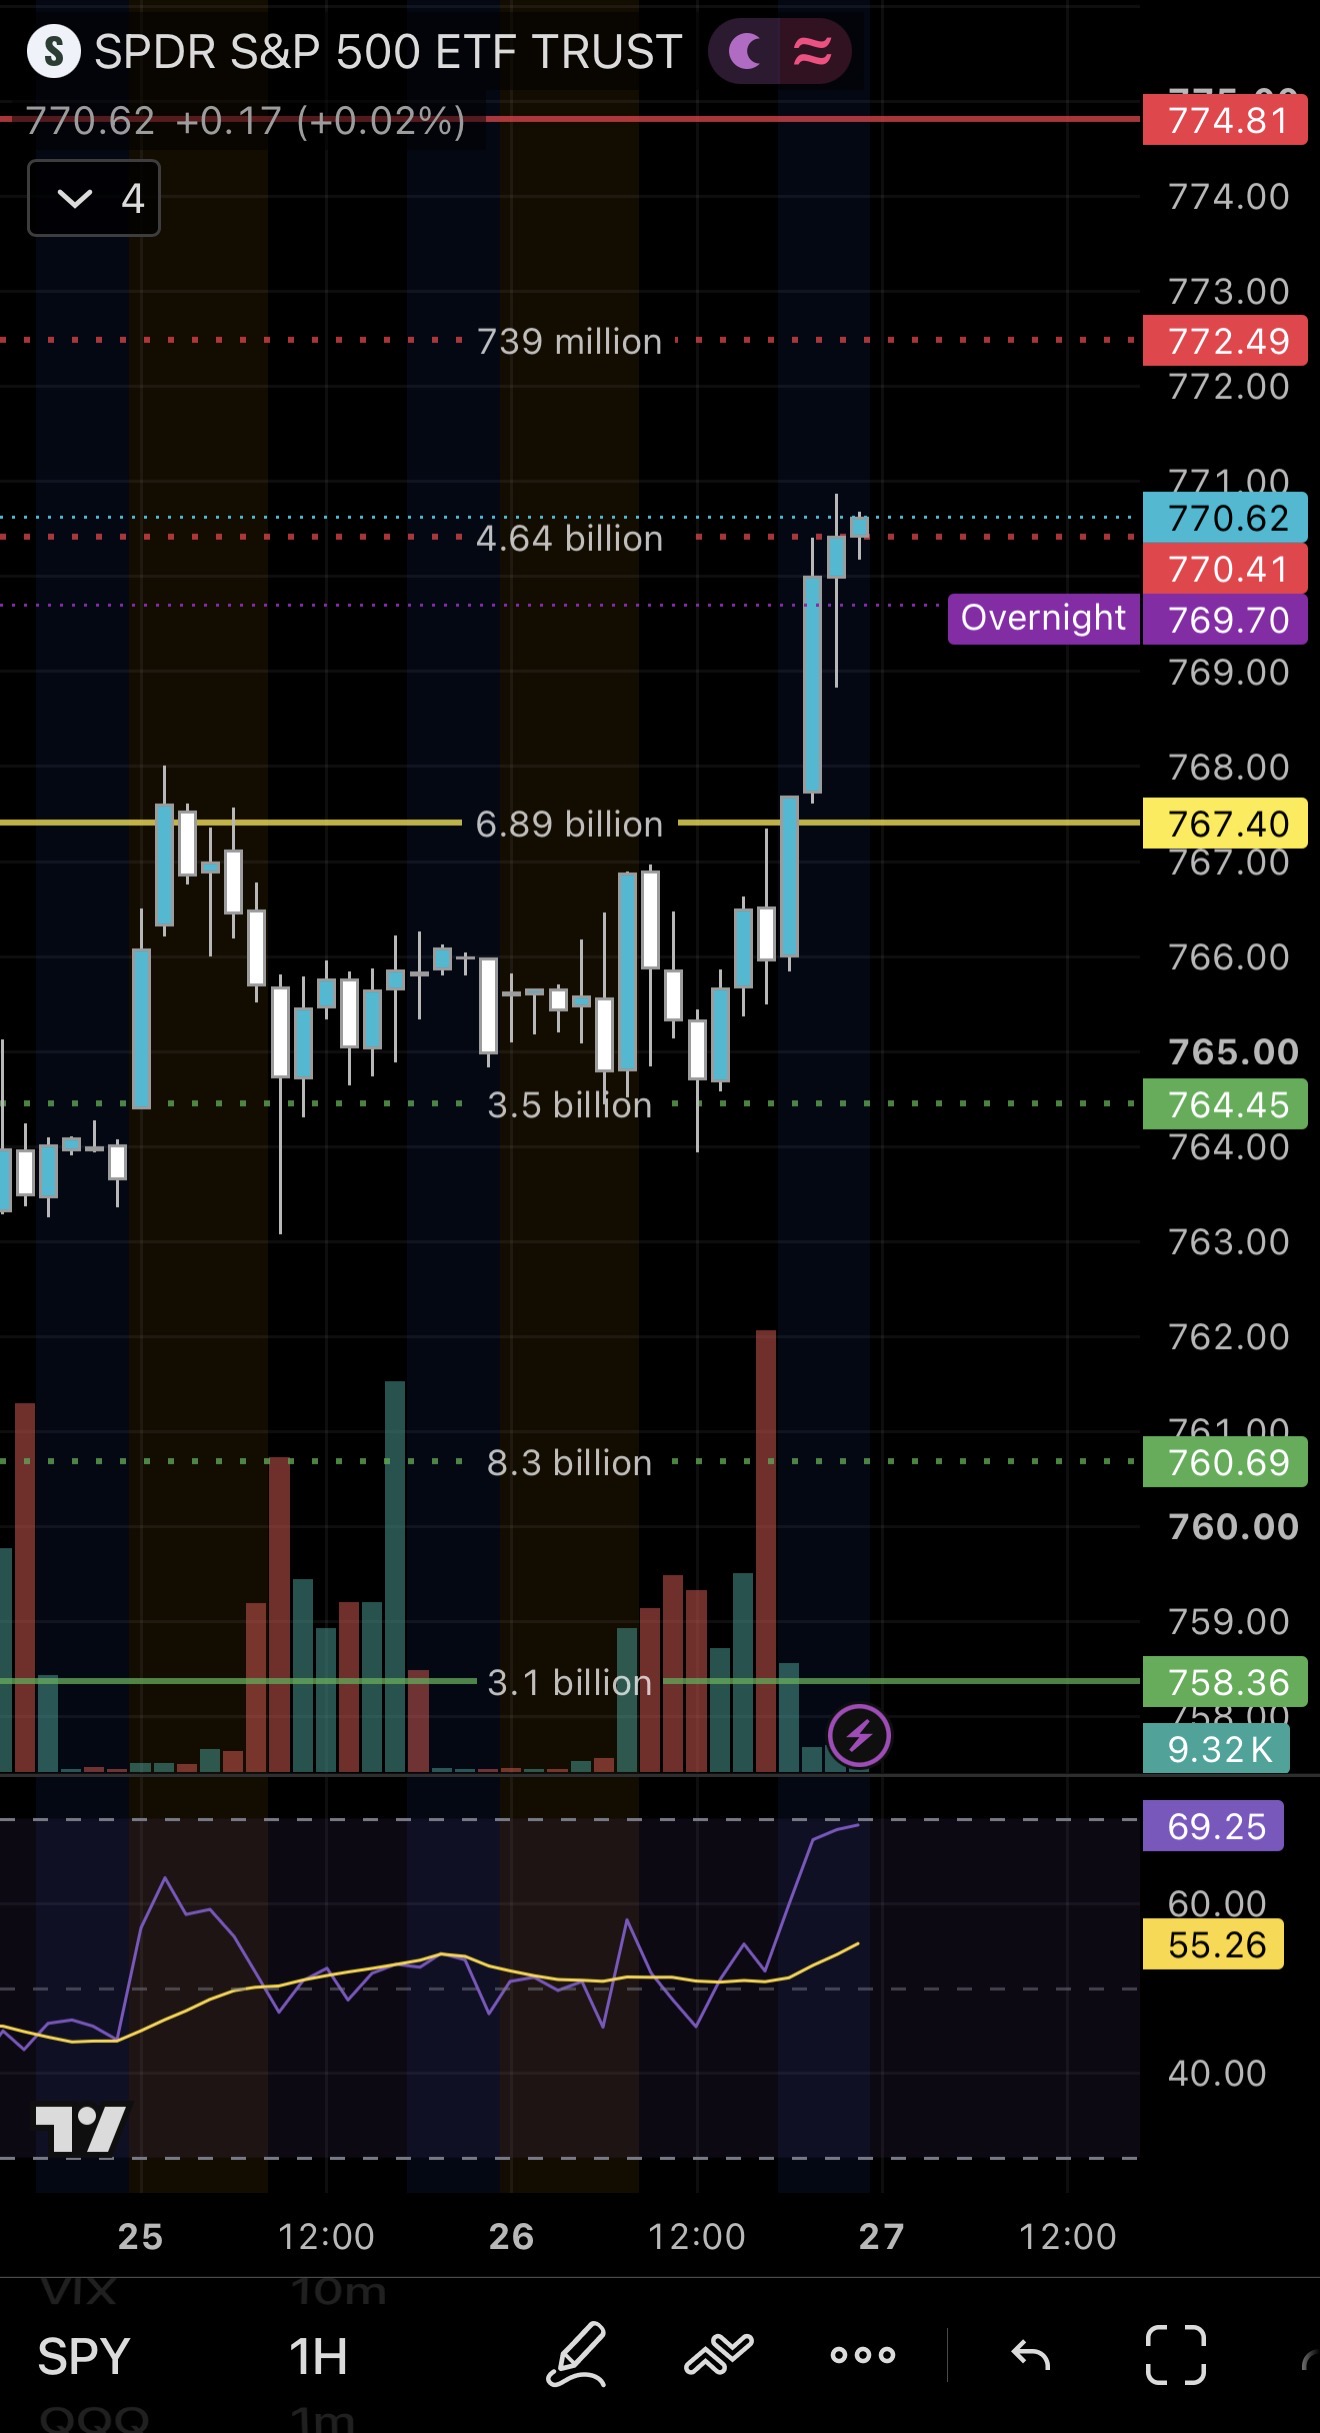
If a desk accumulated size between $764 and $767 like our current chart above, that zone is now inventory. When price comes back, they have a reason to defend it. You did not invent the level. They paid for it.
Large orders also rarely finish in one print. A cluster over several sessions often means a desk is still working the same idea for the other side is waiting to fade the same price they sold.
Heavy notional also acts like a magnet. Price is drawn back to where the most business already happened. Same logic as a volume profile, except a large share of the real size never hit the lit book. And the flip still applies. Broken resistance becomes support. Failed support becomes resistance. The print marks where inventory transferred. Once that inventory is gone, the level’s job changes.
Wall or fuel
When the tape is quiet, dark pool clusters behave like shelves. Price tests the zone, gets absorbed, rotates. That is the S/R use.
When data or an event hits like today’s PCE, or FOMC, earnings, etc., a gamma flip the same DP shelf can become a launchpad. The liquidity is already sitting there. If a dealer or institution now has a reason to get aggressive, they do not have to hunt size on a thin public book. They can spend what is resting in the dark, cross the level, and force stops and hedges to chase. The pool did not cause the event. The event gave someone permission to use the inventory.
Location plus volume is a trade.
Location plus nothing is just a line. As always volume is 🔑
Read it like a heatmap
You want to see multiple expi dates coincide at a certain level for confluence.
In terms of dark pool One isolated print treat as noise until it is retested. Unless above 1.2 Billion on index’s. However, A Heavy Blow is prints in a range see it as someone building or rotating while the public gets bored. Typically I cluster these on one line to reduce clutter if within .75-$1.20.
A dark pool shelf stacked with an options wall is perfect confluence. This is when the line earns extra weight and becomes a “working stack”
The working stack
Heatmaps show where options positioning forces the tape to care. Dark pools show where cash size already voted. When those maps agree, you are no longer drawing a random Fibonacci(still can be used but not always needed with this system).
Hold and reclaim would mean the shelf is still in play in my head and the play is alive.
Close through it on volume, the inventory thesis is broken. Next cluster/DP line below becomes the target
The point
Public charts show the battle that was allowed to be seen. Dark pools show the battle that was hidden on purpose then reported because it has to be. That delay is the tax for being retail. The compensation is that the receipt still marks the inventory which gives us the S/R lines on the chart. Watch heatmaps for where options positioning forces the tape to care.
Watch dark pools for where commons share size is.
Educational only. Not financial advice. Dark pools are legal ATS venues under SEC/FINRA rules. Levels fail. Size risk as if the print you are leaning it