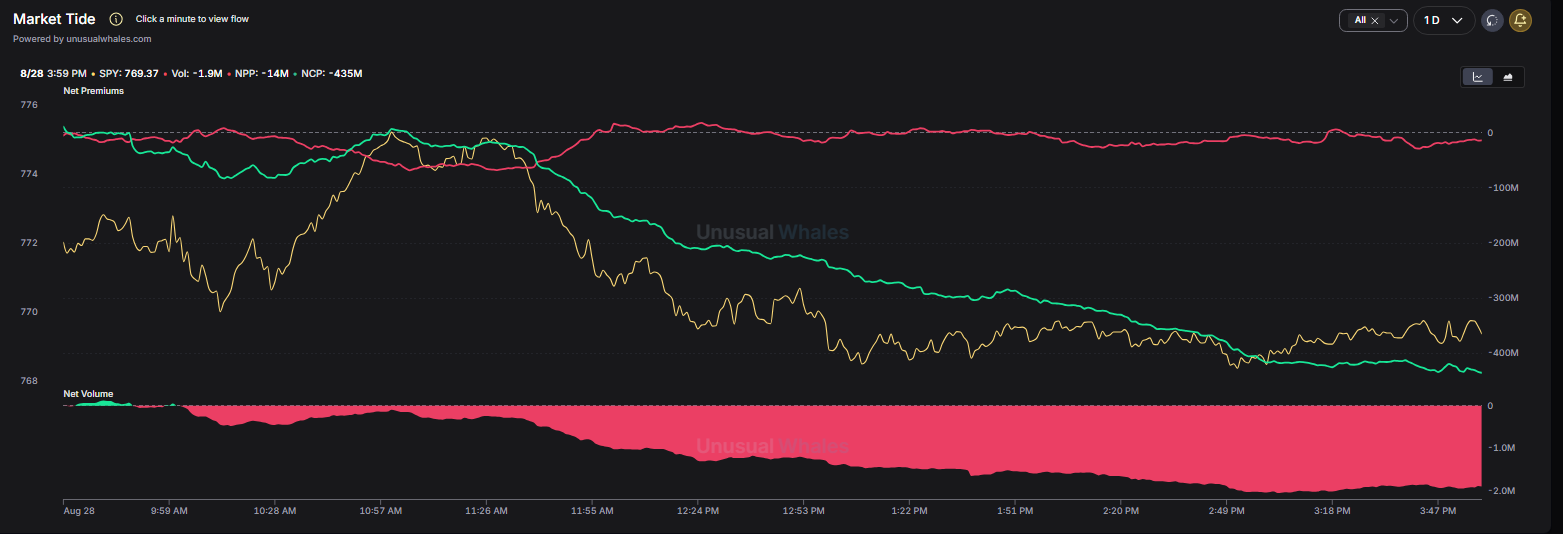
Some people use GEX/VEX maps to determine when to take a trade, but using this in combination with market tide and net premiums is how I determine daily trend on the indexes before combining the other elements.
Using a checklist of looking at:
1. Market Tide
2. 0DTE Net Premium (QQQ, SPY, NVDA, MU)
3. 1DTE Net Premium (QQQ, SPY, NVDA, MU)
4. Overall Net Premium (QQQ, SPY, NVDA, MU)
5. GEX/VEX Maps
Gives me confidence of whether to enter a put/call trade and when to take profit. Watching for spikes in call/put premiums and seeing net premiums diverge from call heavy to put heavy can help you understand which direction the market will trend. A good example is on Friday, during the Warsh speech. We knew that we had a call wall at 775 and once that call wall was hit, we can see that puts crossed calls on Market Tide and SPX gave us a 70-point dump. Net premiums did not follow suit, but understanding where resistance was and seeing calls exiting were the early signs that we will probably see a change of structure.
When you combine market tide, net premiums, and GEX/VEX maps this is how you can have greater conviction to know what direction a trade will go! Paying attention to the market leaders such as MU and NVDA can help you forecast a move as it brewing by applying this same strategy.